Features
One product for the whole race — before, during and after
SailTac is a small server that runs on the boat's Windows computer. It reads your NMEA instruments and serves a fast interface to every device aboard. Here is what it does, in the order you'll use it.
01 · Plan
Weather routing that admits what it doesn't know
Every routing tool draws a confident line across the chart. SailTac draws the same line, then colors each leg by how much the forecast models actually agree with each other there. Green means they concur. Red means the routing is a guess, and you should keep your options open.
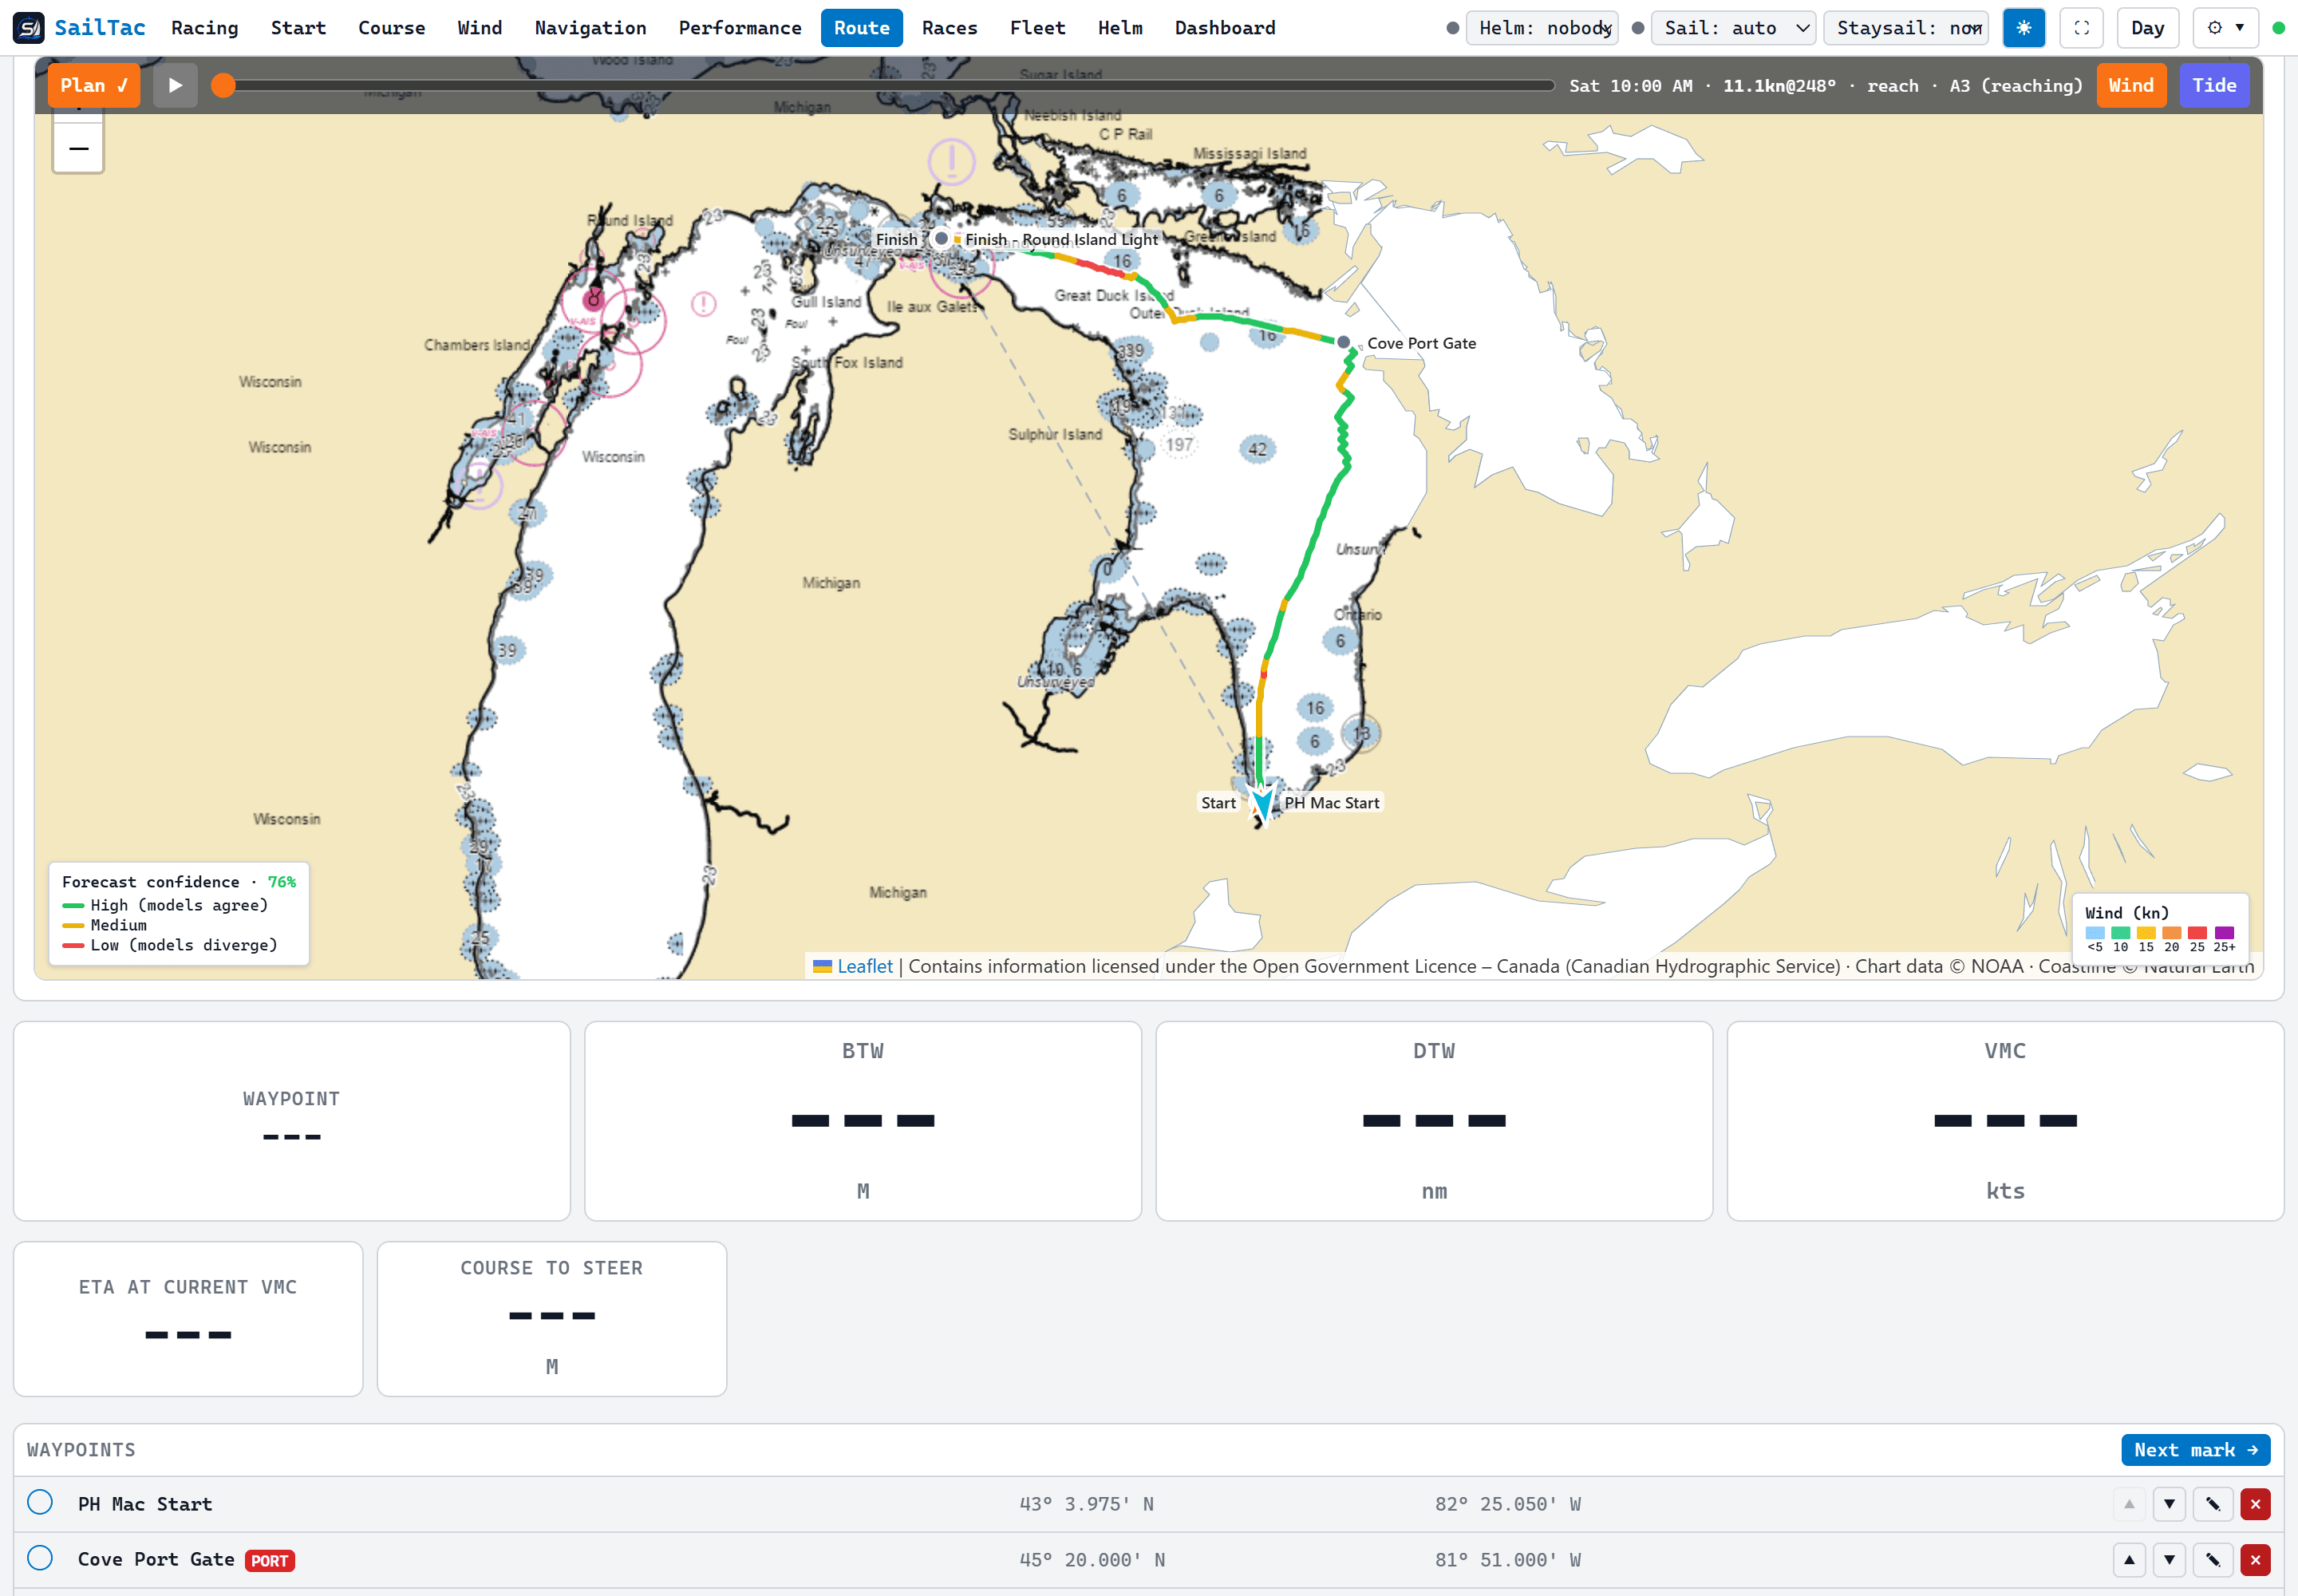
In the routing engine
- Isochrone optimal routing over your boat's own polar, with land avoidance
- Multi-leg courses that route mark to mark, chaining each leg's ETA into the next leg's forecast
- Mark rounding-side constraints — leave to port or starboard
- Plan a start up to 16 days ahead and route that moment's forecast
- Expedition-style leg table: ETA, distance, tack split, average boat speed and the sail called for each leg
- Animated wind overlay with a time scrubber — play the whole race forward
- Save plans, reload them, and overlay the race you actually sailed on top
- Cache every chart tile for the course in one click, before you leave the dock
The six models
Each model has a different resolution and a different horizon. SailTac tracks both: a 48-hour high-resolution model is used for the hours it actually covers and dropped after that, rather than being blended in as calm air and quietly dragging your forecast down.
| Model | Source | Grid | Horizon |
|---|---|---|---|
| ECMWF | European Centre | 25 km | 360 h |
| GFS | NOAA global | 25 km | 384 h |
| ICON | Deutscher Wetterdienst | 13 km | 180 h |
| HRRR | NOAA rapid-refresh | 3 km | 48 h |
| HRDPS | Environment Canada | 2.5 km | 48 h |
| NAM | NOAA mesoscale | 12 km | 60 h |
02 · Race
Instruments for the whole crew, not just the nav station
The interface is served over the boat's Wi-Fi, so the tactician on the rail, the trimmer at the winch and the navigator below are all looking at the same live data on their own devices, each with the layout they want.
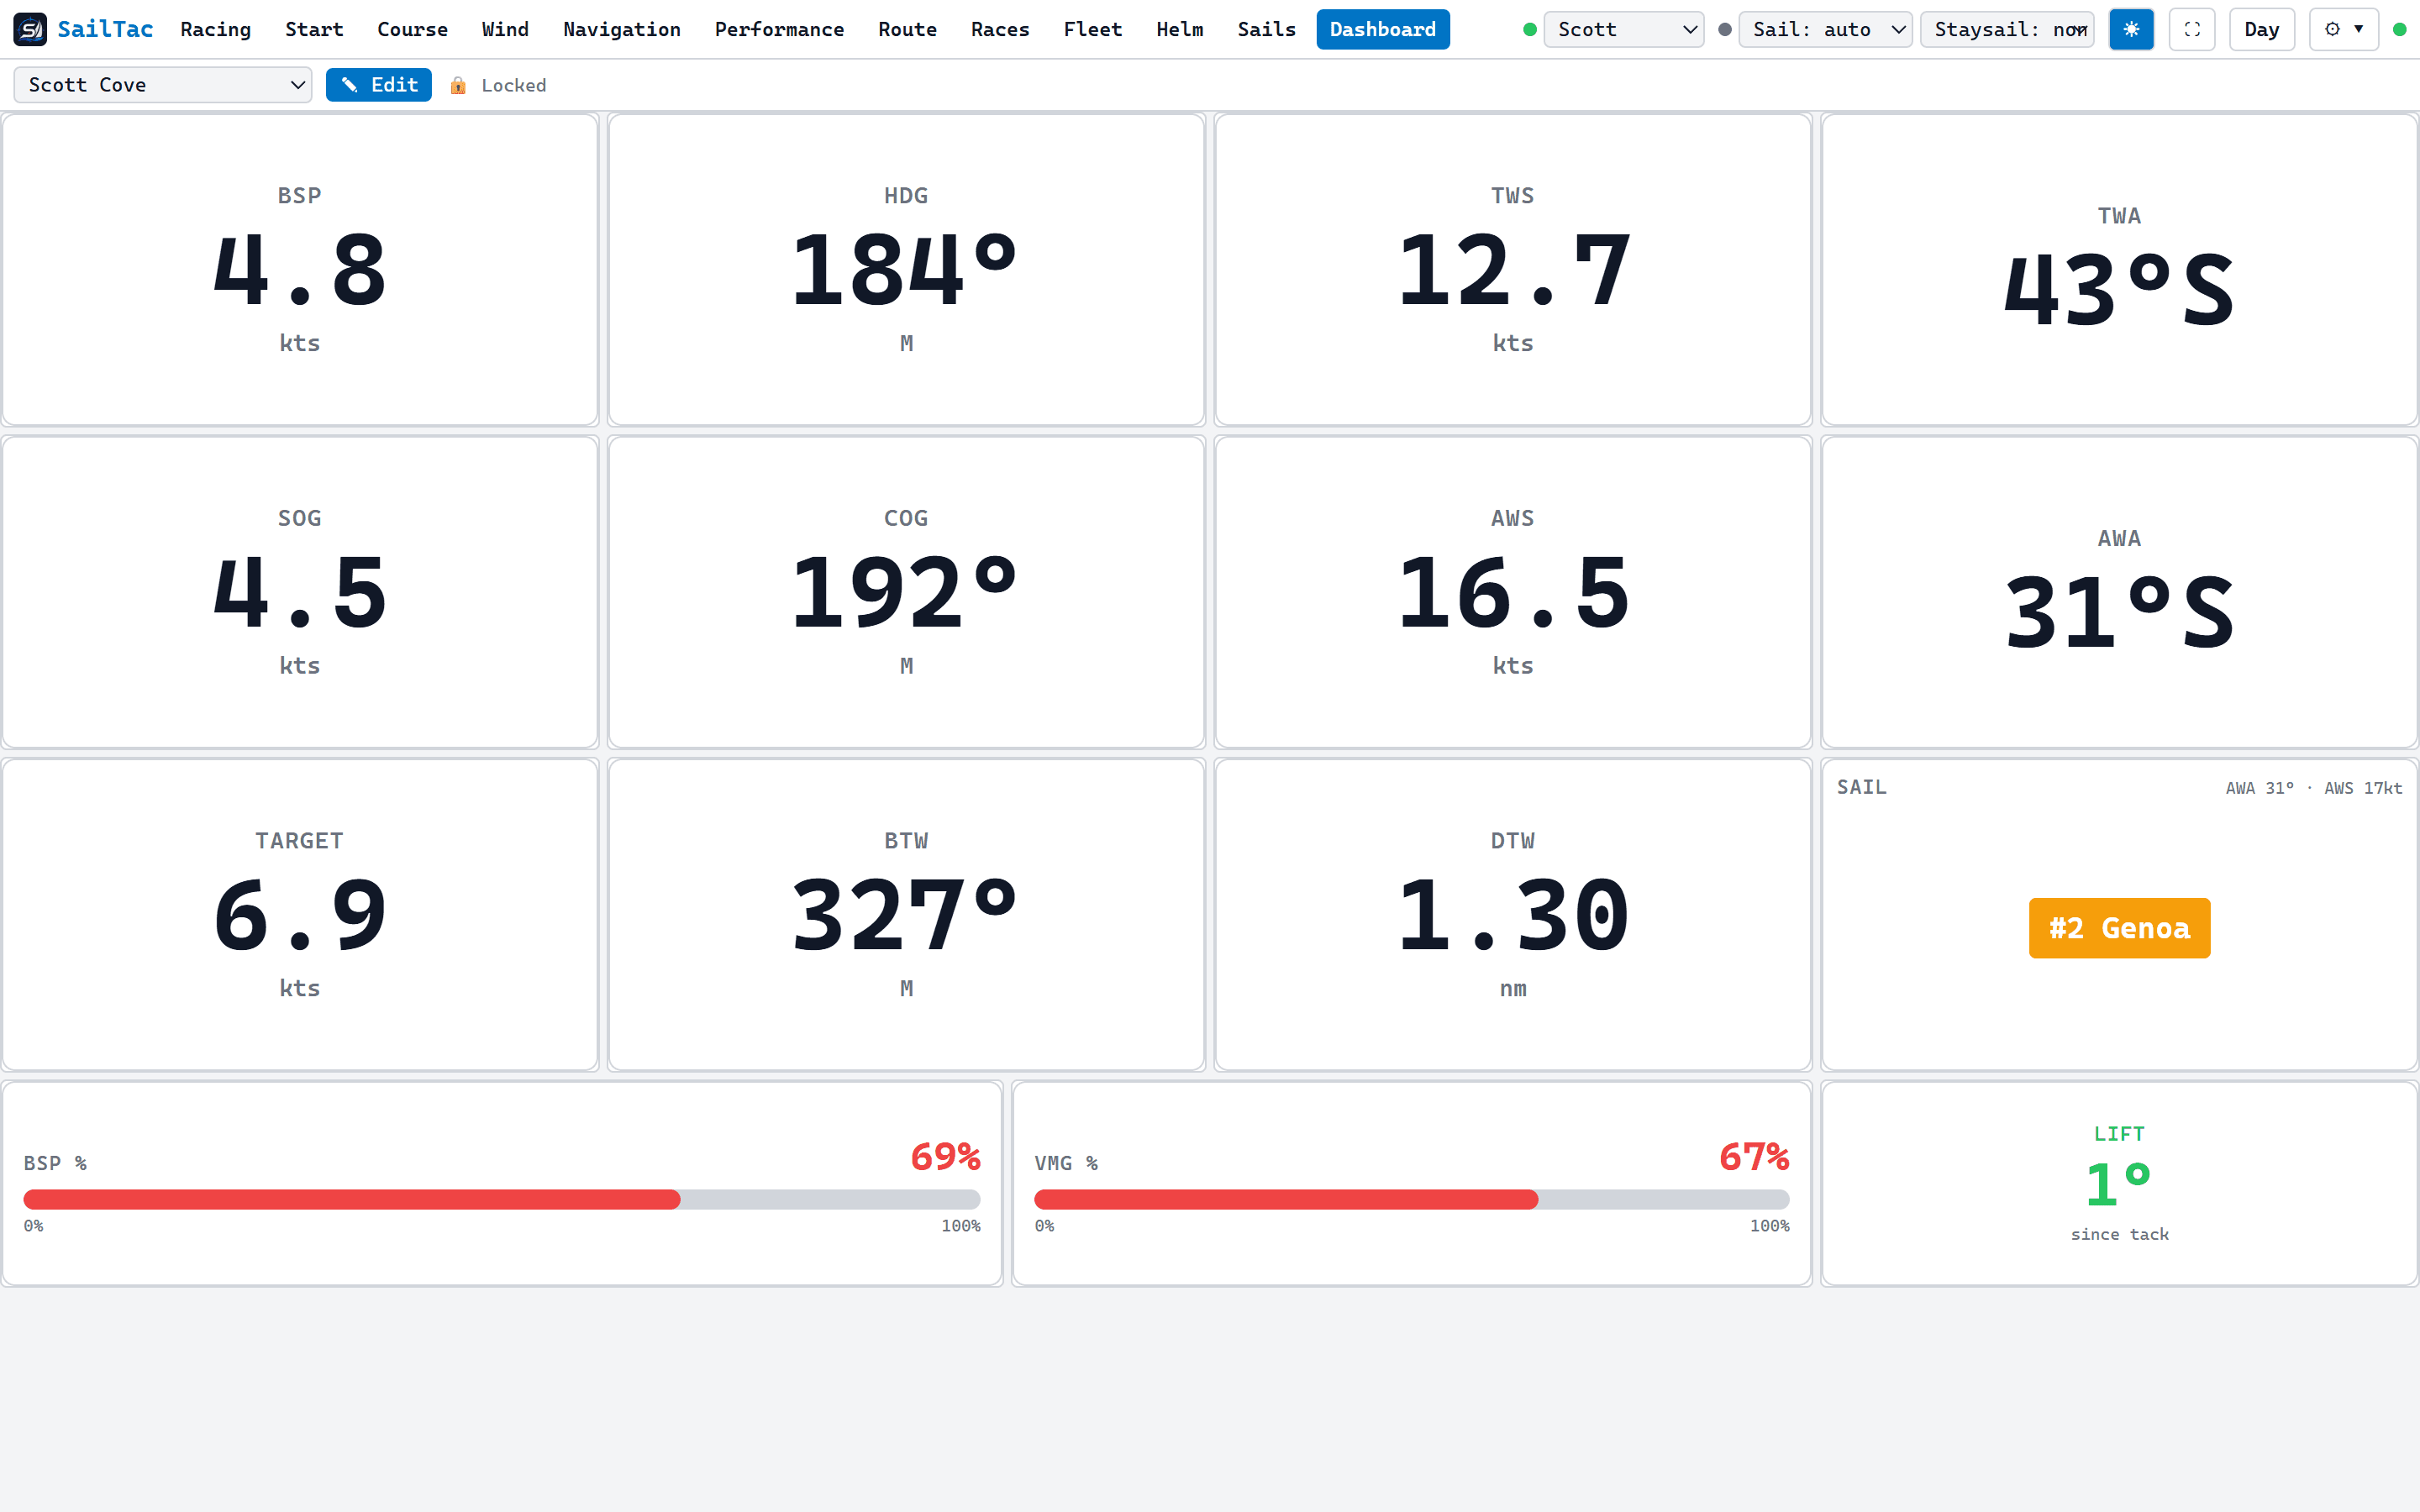
On the water
- Live displays on every phone, tablet and laptop on the boat's Wi-Fi
- Custom dashboards built from 30 widgets, dragged and resized, saved per crew member
- Day, night and high-contrast themes — red-on-black for the dark watches
- One-touch race start that freezes the forecast for later scoring
- 1 Hz logging of position, wind, speed, heading, helm and sail
- Automatic mark rounding and course advance while you race
- Lift and header tracking with a tack-relative reference that resets on each tack
- Magnetic or true heading, with the World Magnetic Model built in
- Crash-resume: kill the power mid-race and it picks the same race back up
Every screen in the app
Racing
The numbers that matter on the rail, big enough to read wet.
Start
RRS 26 sequence, line bias, pin and boat pings, time to gun.
Course
Leg sequencer with auto-advance and overstood layline warnings.
Wind
True and apparent wind, shifts, and the lift/header picture.
Navigation
Range and bearing to the active mark, ETA, VMC, depth.
Performance
Boat speed against target, by point of sail and wind band.
Route
Weather routing, the leg table, saved plans and the wind overlay.
Races
Every race you've logged — analyze, report, recap, results.
Helm
Who's driving, and how each of them does in what conditions.
Sails
The crossover chart, live: the right sail lights up.
Dashboard
Build your own screens from 30 widgets, saved per crew member.
03 · Analyze
The argument on the dock, settled with evidence
Did we lose that race in sail selection, helming, maneuvers or routing? Was the staysail worth flying? Which model should we have trusted? Who should drive the night watches? SailTac answers all four from the log — and tells you when it can't.
Every figure has a basis
Maneuver loss is measured from the real speed drop through each logged tack, not from a rule of thumb. Routing loss reports “not measurable” if you didn't save a plan to compare against, rather than inventing a figure.
Estimates that overlap say so
The loss attributions are independent overlapping estimates, and one can exceed the total — fixing your staysail use and your helming together would push you past polar. The report states this instead of adding them up into a satisfying, wrong number.
Compressed demos aren't scored
Run a sped-up demo race and the model scorecard refuses to grade it, because the log times don't line up with a real forecast. It says so and waits for a real race.
After the finish
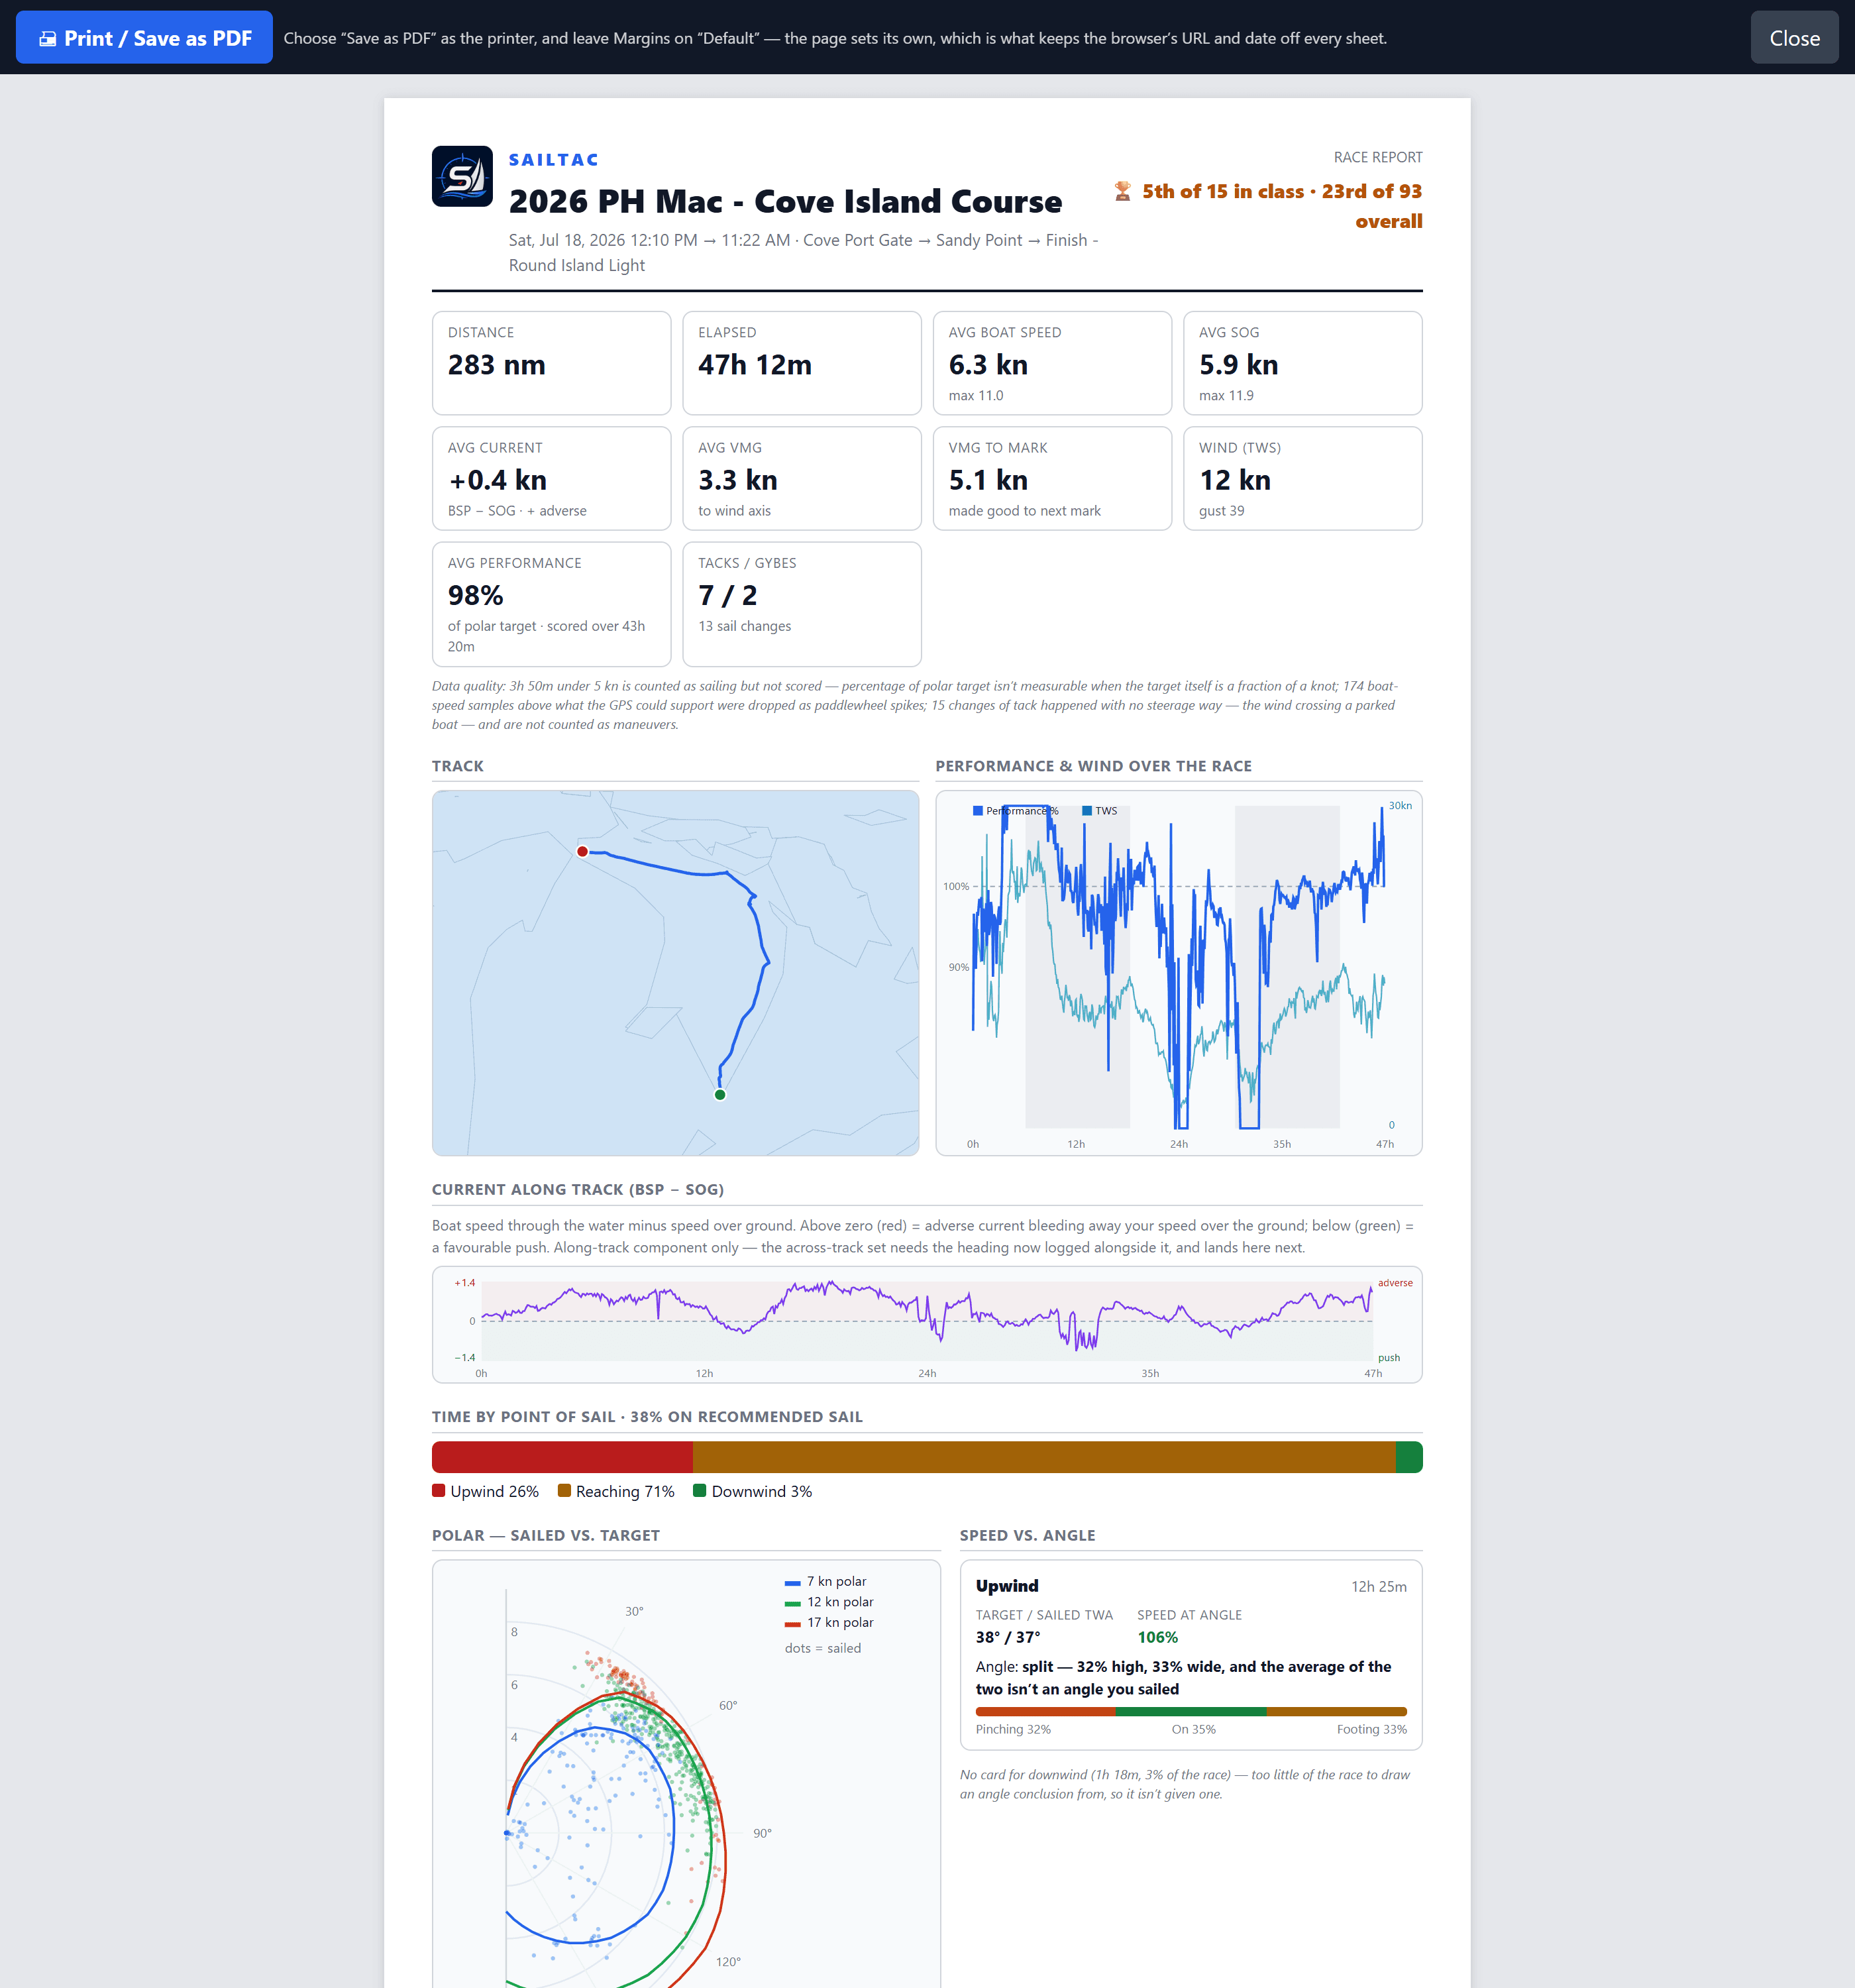
- Automated debrief attributing time lost to sail selection, helming, maneuvers, staysail use and routing
- Per-forecast-model accuracy scorecard, ranked on true wind speed and direction error
- Polar plot with your sailed scatter over the target curves
- Pinch / on / foot angle discipline against the polar's optimal VMG angle
- Wind-shift strip with tack markers and a shift-play verdict
- Sail-change timeline and per-sail wind and angle envelopes
- Staysail effectiveness versus the same primary sail without it
- Helm performance by point of sail, wind band, and day versus night
- VMG to the wind axis and to the mark, plus along-track current
- Multi-page printable PDF report, and a 4:5 recap card for socials
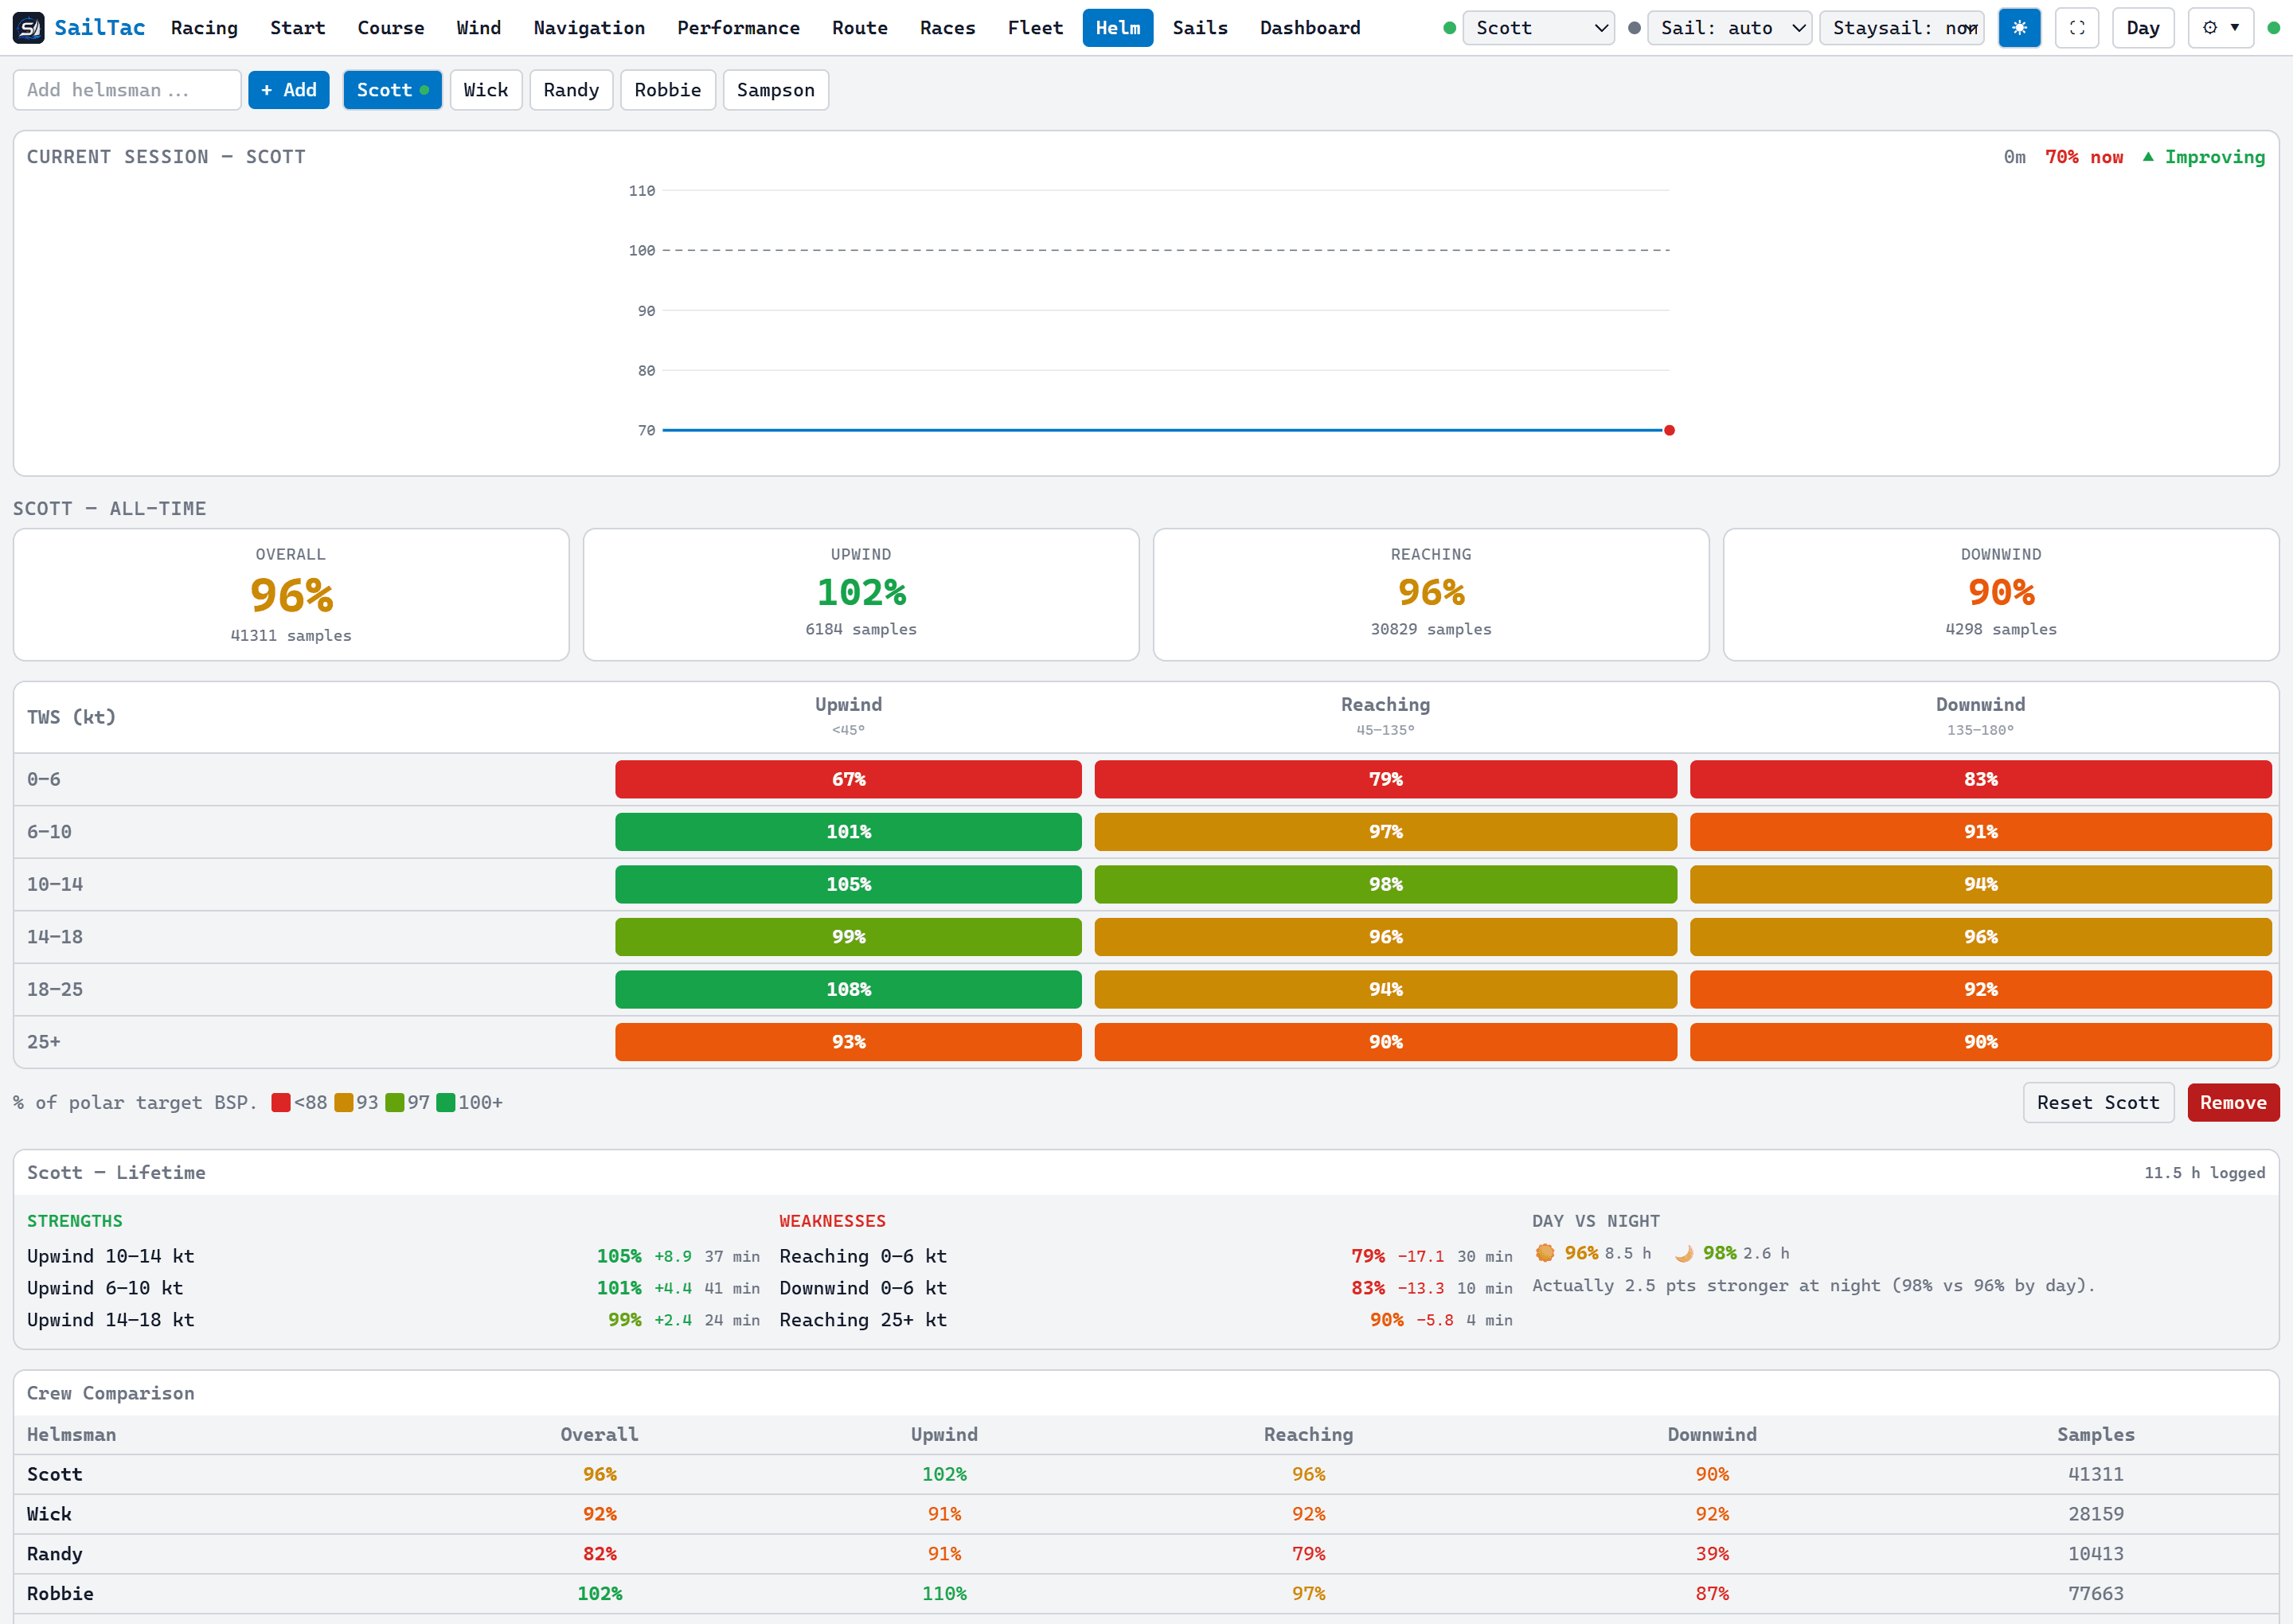
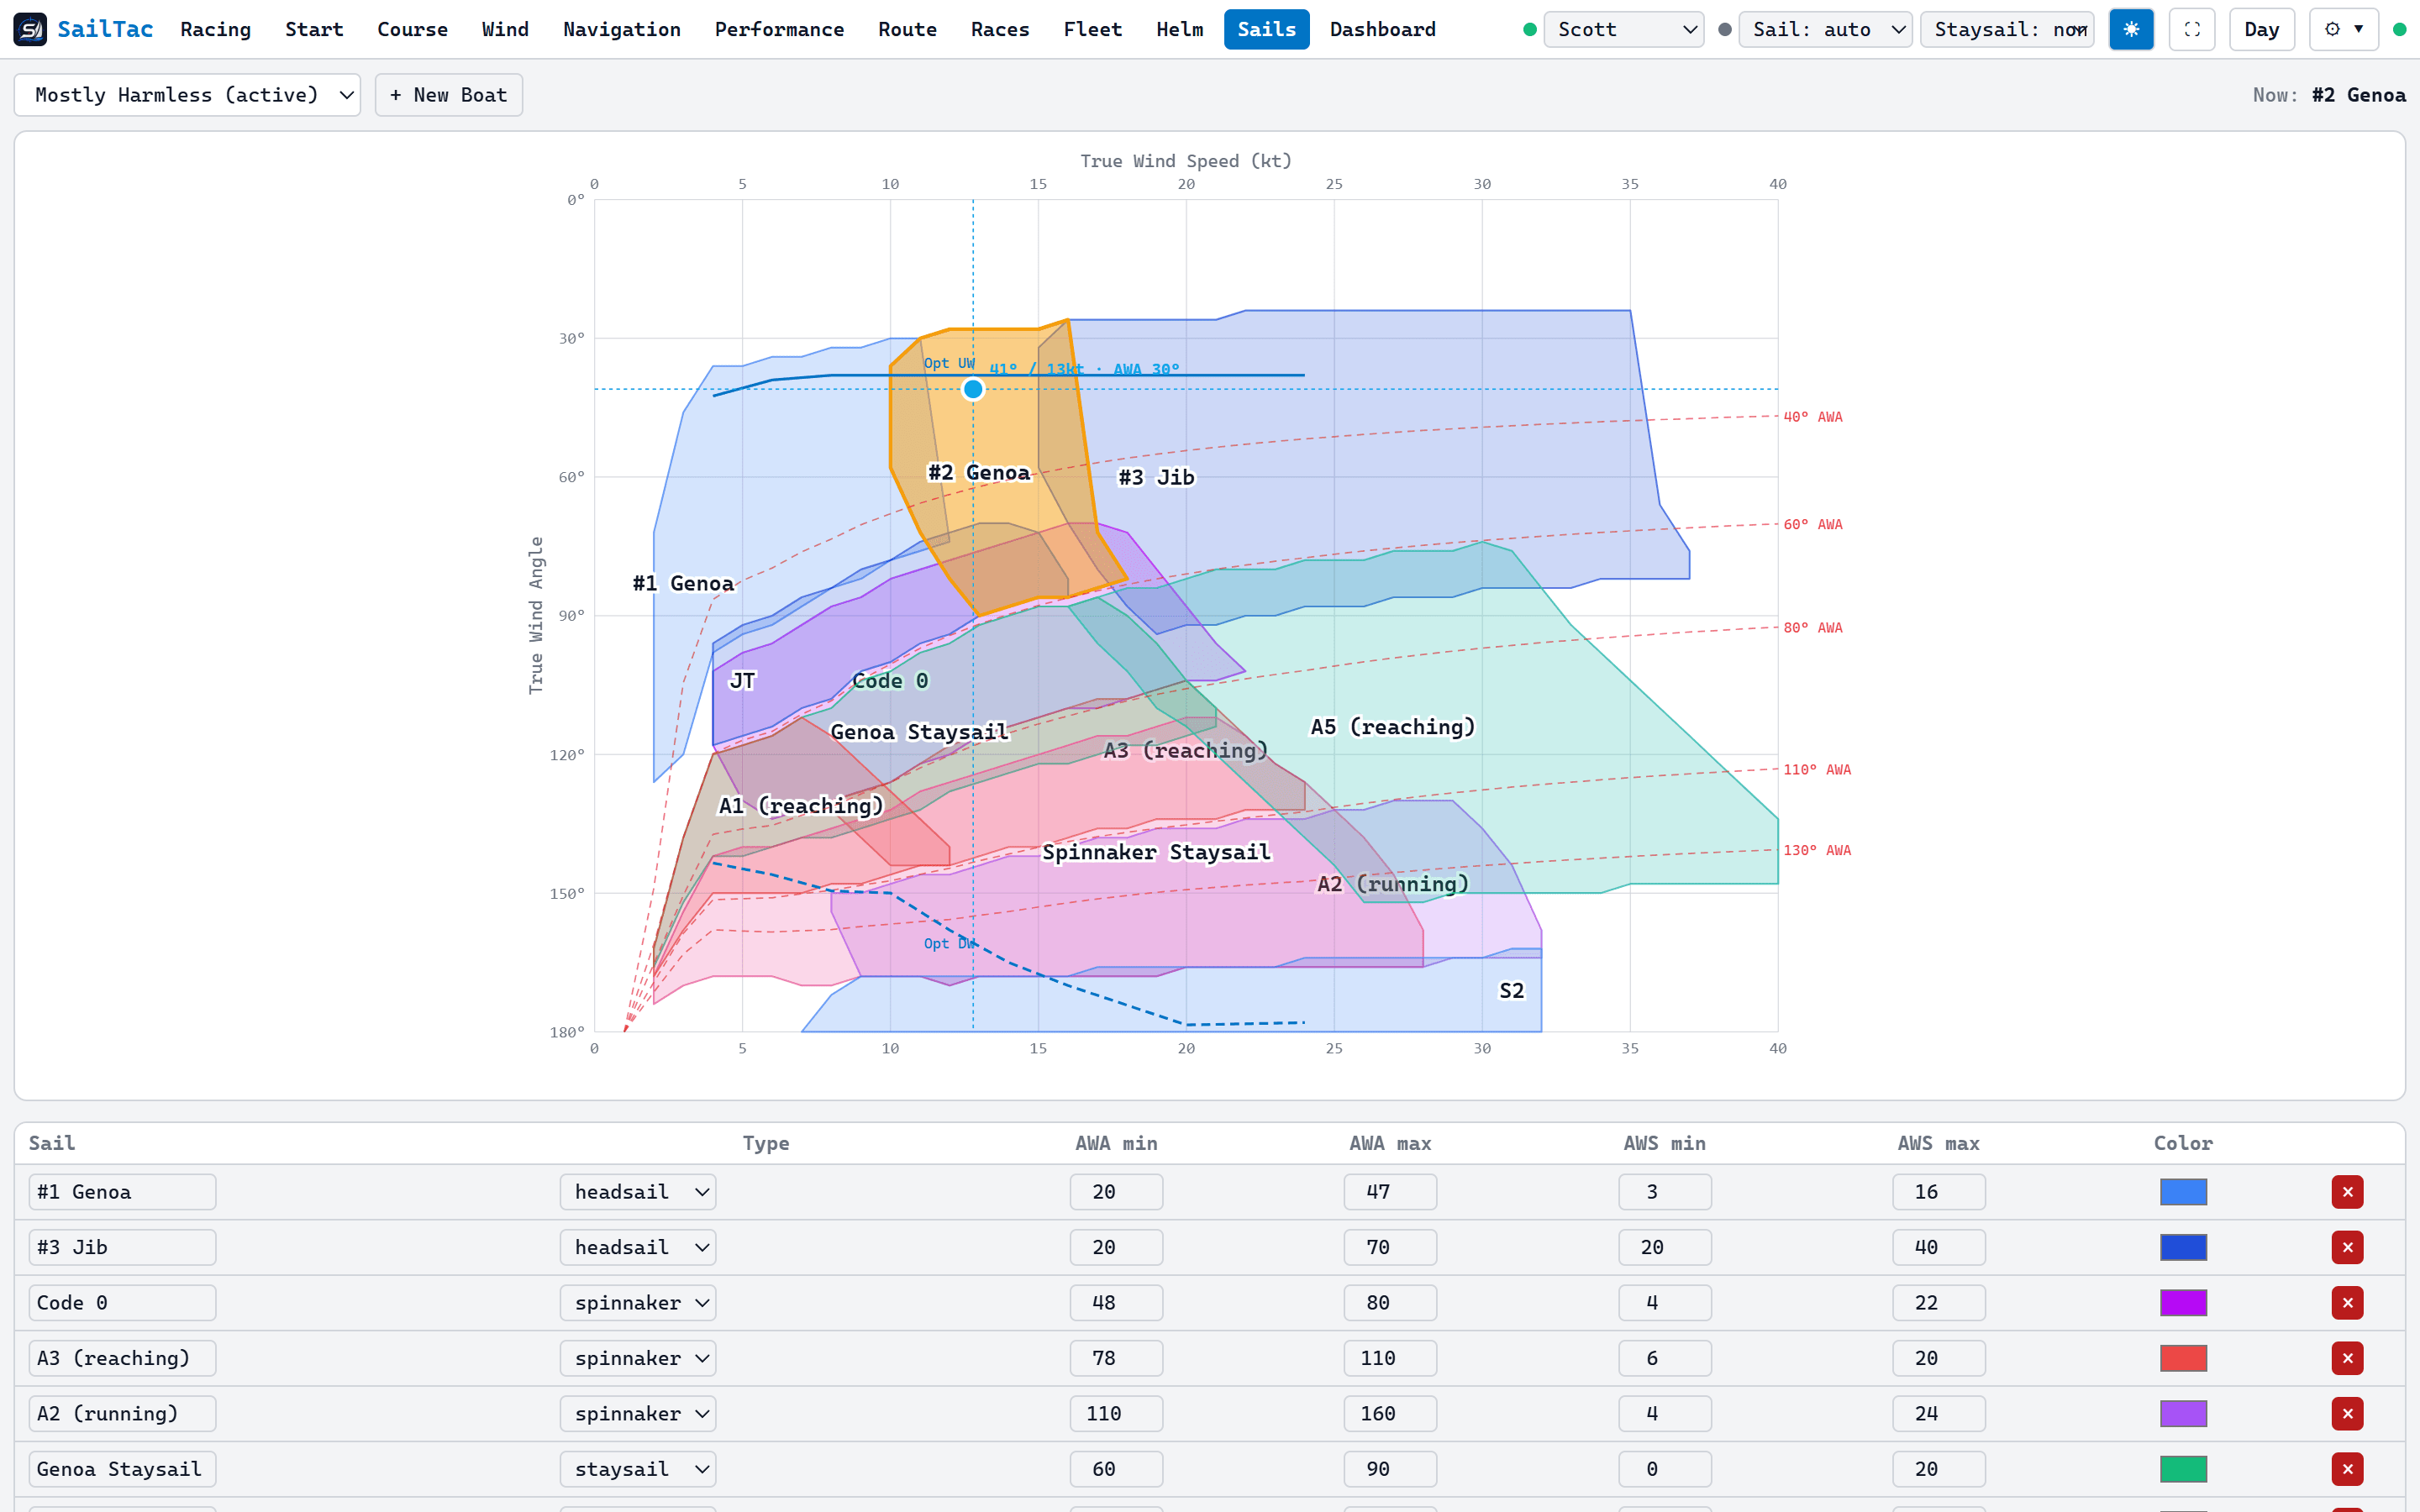
Reliability
Because it has to keep working at 3am, 90 miles out
The classic failure mode of marine software is shipping something that breaks offshore. Everything below exists because a real race needed it.
Reconnects itself
Instrument sources reconnect after a power blip with a half-open watchdog and exponential backoff. Your NMEA configuration is saved to disk, so a reboot mid-race comes back on its own.
Append-only logging
Race samples are appended and flushed every 15 seconds. A hard crash costs you seconds, not the race.
Crash-resume
Kill the app mid-race and it resumes the same race on restart, still logging.
Health panel
Every source with its data age, whether data is flowing, log growth, memory and whether the disk is writable. No guessing.
Tested for length
A 72-hour, 259,000-sample race is in the automated test suite — analysis, export and all. Multi-day races were the design target, not an edge case.
Demo mode that can't lie
The built-in simulator suspends real instruments while it runs, banners the whole app in purple, and is always off after a restart. Simulated data can never be mistaken for yours.
See it on your own instruments
Download it free, run the built-in demo on the kitchen table, then plug it into the boat. The trial is 30 days and every feature is in it.